Using a comprehensive n8n interface guide is the most effective way to transition from a beginner to a professional automation architect. The n8n platform is designed for both high-level management and detailed logic construction. The layout is divided into two main environments: the Home Dashboard, which focuses on system health, and the Editor Workspace, where the visual logic is built.
1. The Home Dashboard: Analytics and Navigation
The Home Dashboard serves as the command center for monitoring the entire automation ecosystem. Within this n8n interface guide, we break it down into three primary zones.
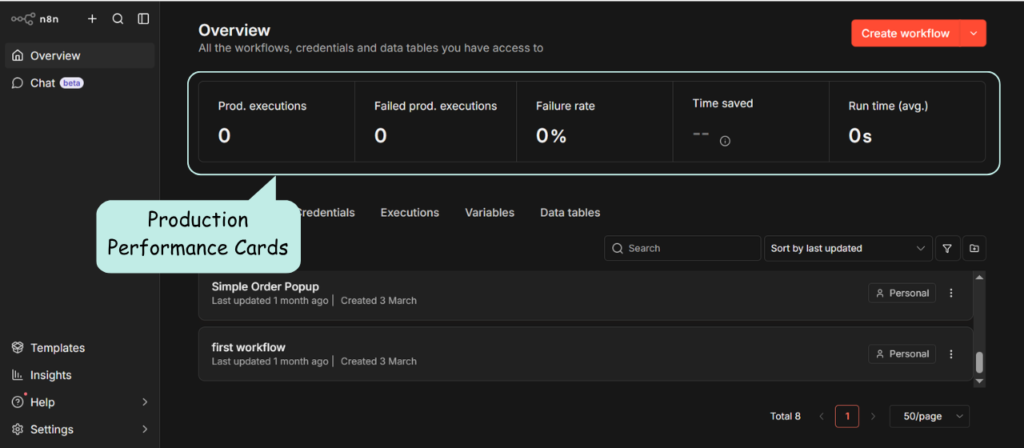
A. Production Performance Cards
At the top of the dashboard, five real-time metrics provide a snapshot of the live environment:
Prod. Executions: Total count of every time a published workflow has run.
Failed Prod. Executions: The number of errors in live projects.
Failure Rate: The percentage of unsuccessful runs; 0% is the indicator of a healthy lab.
Time Saved: An estimate of manual labor hours replaced by automation.
Run Time (avg.): The average duration for a workflow to complete.
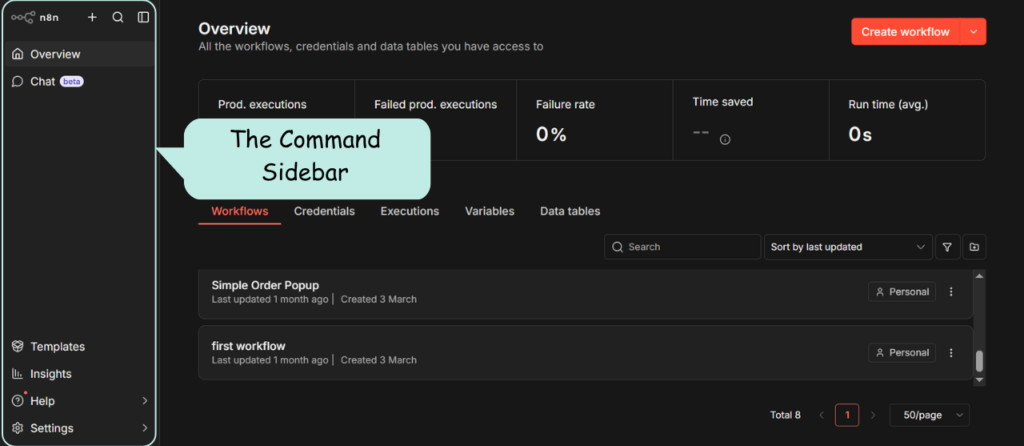
B. The Command Sidebar (Left Navigation)
The vertical sidebar on the far left handles high-level navigation:
Overview: The home base for metrics and project lists.
Chat (beta): An AI assistant for troubleshooting and logic generation.
Templates: A library of workflows ready for immediate use.
Insights: Advanced analytical trends for monitoring long-term performance.
Help: Direct access to official n8n documentation and forums.
Settings (Gear Icon): For managing the system engine and security.
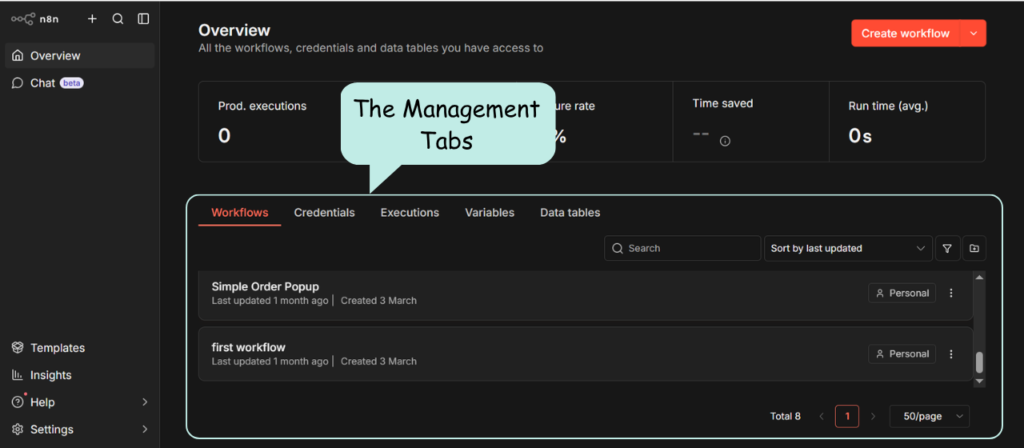
C. The Management Tabs (Bottom Section)
Below the performance cards, use these tabs to organize your core assets:
Workflows: The central list of all saved projects and their statuses.
Credentials: A secure vault for API keys and authentication tokens.
Executions: The global history log for diagnosing errors across all workflows.
Variables: A storage location for global data points used in multiple projects.
Data Tables: A built-in database for managing information internally.
2. The Editor Workspace: The Building Canvas
Opening a workflow transitions the interface into the Editor Workspace. This grid-based canvas is where logic is constructed and tested. This part of the n8n interface guide focuses on the “builder” view.
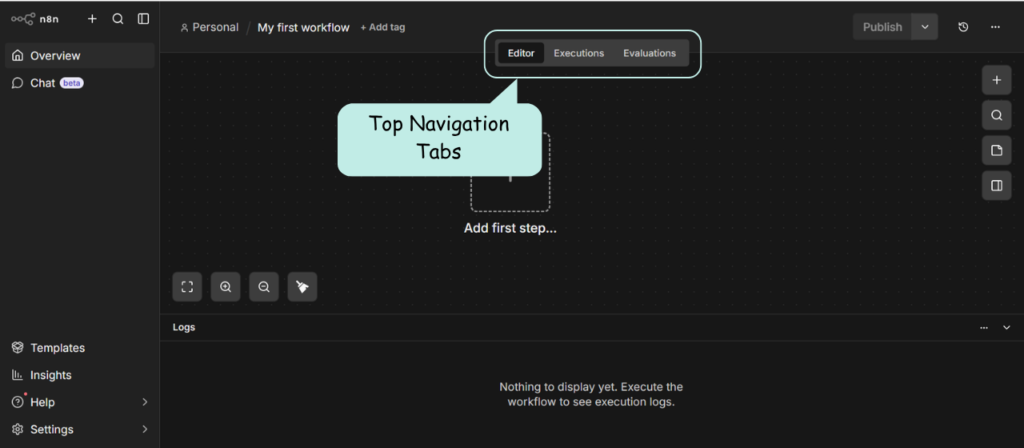
A. Top Navigation Tabs
The top-center navigation bar allows for switching between views:
Editor: The primary zone for dragging, dropping, and connecting nodes.
Executions: A history of every time this specific workflow has run.
Evaluations: A tool for testing data transformations and performance.
Workflow History: A version-control system to restore previous versions.
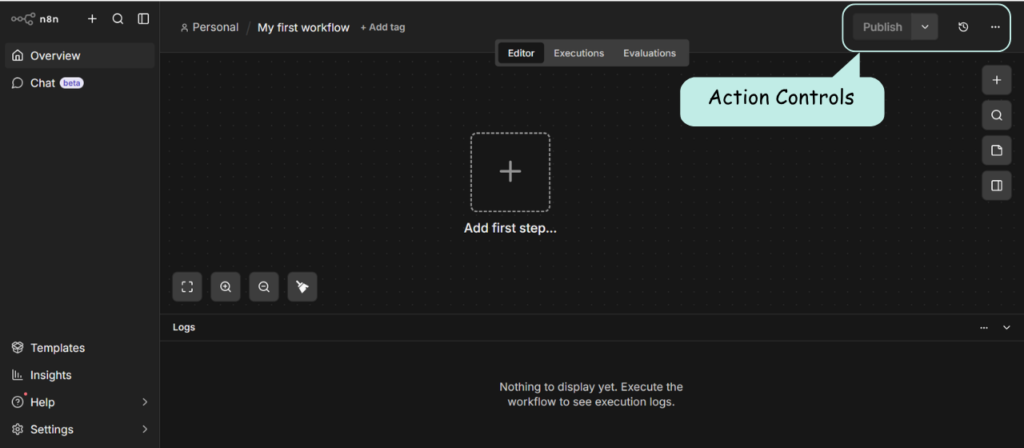
B. Action Controls (Top Right)
Execute Workflow: The manual testing button to run the logic on the canvas.
Publish / Active Toggle: The switch to push the workflow live.
The Three-Dot Menu (⋮): Options for Import/Export and error-handling configurations.
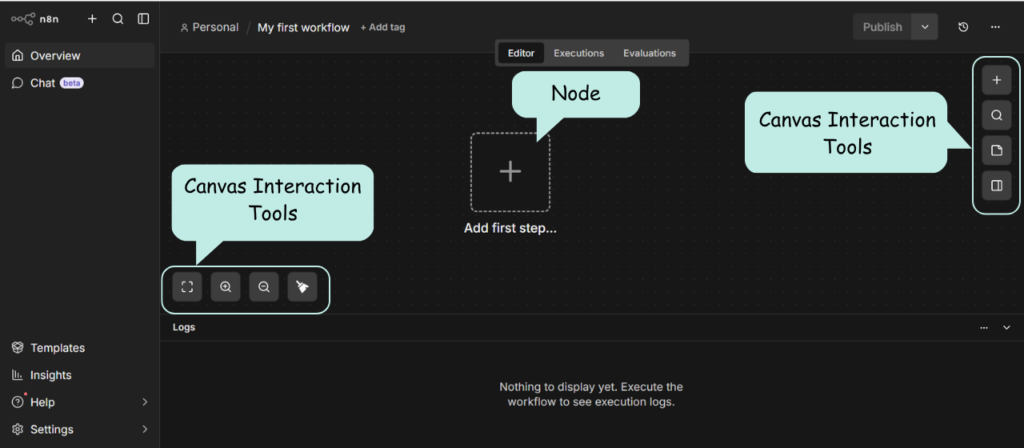
C. Advanced Canvas Interaction Tools
Navigating and organizing the workspace is managed through specific icons and shortcuts:
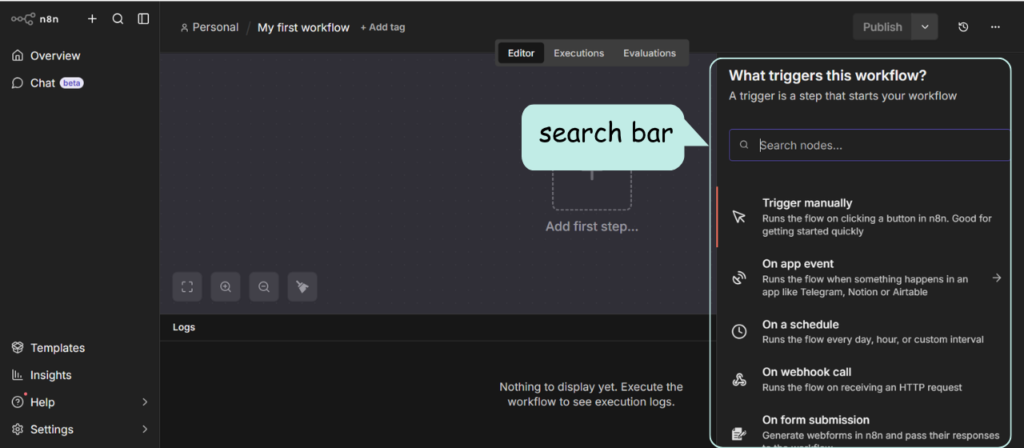
Command Bar: A quick-action search bar (often accessed via
Cmd/Ctrl + K) to find nodes or trigger actions instantly.Tidy Up: A magic wand icon that instantly aligns all your nodes into a clean, readable layout.
Open/Close Panel: A toggle that hides or shows the sidebar/configuration panels to maximize your canvas space.
Zoom (+ / -): Used to scale the view of the canvas.
Fit to Screen: Instantly centers the entire workflow.
Sticky Notes: Add text-based annotations to document your logic.
Node Library (+ Icon): Opens the search bar for the 400+ available nodes.
Running the Environment Locally
For local installations, the connection between the terminal and the web interface is constant. Running the n8n command starts the engine, and typing o is the shortcut to open the dashboard. For any published workflow to function automatically, the terminal window must remain open and active.
Summary of the Interface Hierarchy
As this n8n interface guide highlights, the layout is designed to keep construction and monitoring separate. The Home Dashboard is used for high-level monitoring via Data Tables and Credentials, while the Editor Workspace is strictly for building. Understanding this hierarchy ensures your automation logic is precise before going live.